TL;DR: US employers lost 3.3% of their employees each month in 2025, on BLS turnover data. The median SHRM member organization reported voluntary turnover of 12% for the year, and the median nonexecutive job took 39 days to fill in SHRM's 2026 benchmarking.
In July 2026, 2.7% of employees at US private workplaces with 50 to 249 staff quit their jobs. At workplaces with 5,000 or more staff, 1.0% did. A turnover rate only means something once you know the workplace size, the time period and the headcount behind it, and the benchmarks HR teams quote differ on all three.
- 1The median organization in SHRM’s benchmarking had 1.98 HR staff for every 100 employees, up from 1.11 three years earlier.
- 2Only 20% of organizations track quality of hire, even though most recruiters say it matters more each year.
- 3Full-time US employees lost 1.7% of their usual work hours to absences, and women’s absence rate was half again as high as men’s.
- 4Median spending on learning per employee fell 28% in 2026 while training hours held at eight a year.
What Is the Average Employee Turnover Rate?
US employers recorded 62.8 million separations in 2025 and made 63.0 million hires, according to the BLS Job Openings and Labor Turnover Survey (JOLTS) annual tables. Total separations averaged 3.3% of employment a month, and hires also averaged 3.3%. Separations count quits, layoffs and discharges, retirements, deaths and transfers to other locations.
SHRM states turnover per year instead. Twelve times the monthly average gives the yearly figure: roughly 40% of the average US workforce left an employer in 2025. That is our calculation from the BLS rate, not a number BLS publishes.
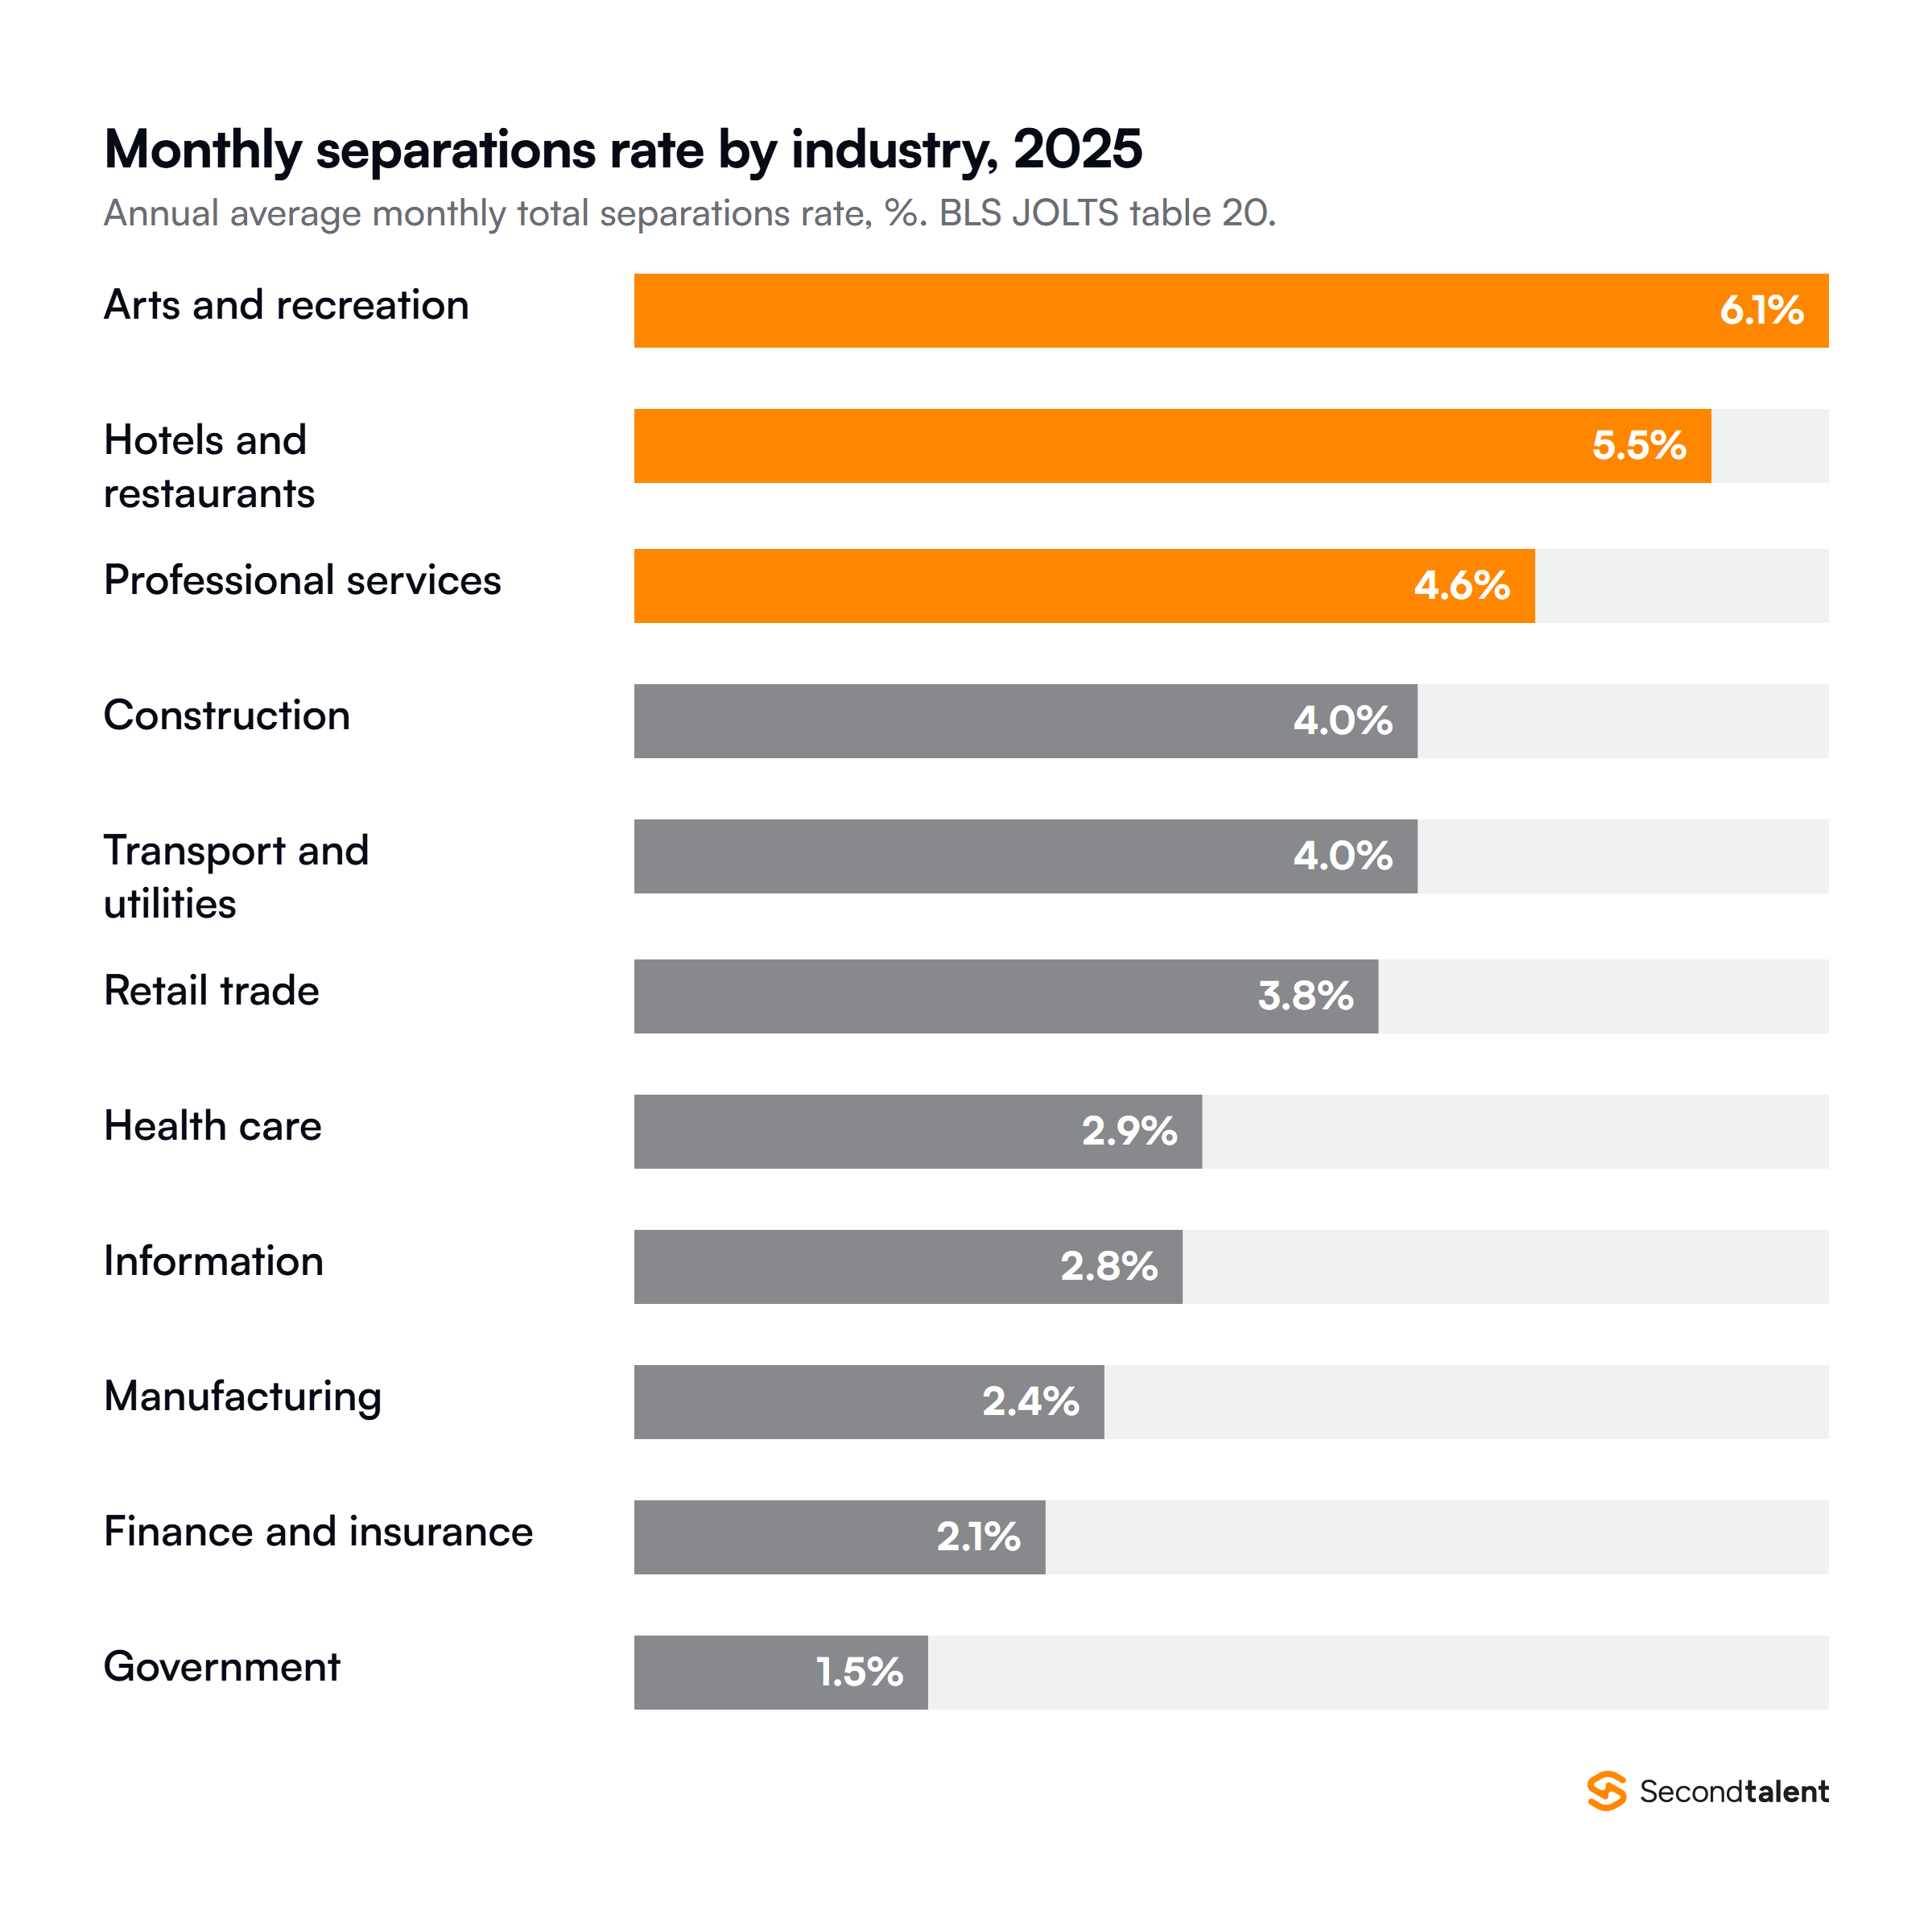
Industry explains most of the spread. Arts, entertainment and recreation lost 6.1% of its workforce a month in 2025, and hotels and restaurants 5.5%. Finance and insurance lost 2.1%, and government 1.5%. The biggest change was in the federal government, where the rate rose to 1.8% from 1.1% in 2024.
Region matters less. The Midwest averaged 3.5% a month and the Northeast 3.0%. Our employee retention statistics split the same BLS tables into quits only, the part of turnover employees choose.
Voluntary turnover: the SHRM benchmark
SHRM’s benchmark measures something narrower. The median voluntary turnover rate among SHRM member organizations was 12% in 2025, the same as in 2022 and above the 9% of 2017, in the 2025 CHRO Benchmarking data brief.
SHRM’s 2026 CHRO brief reports that voluntary turnover has since returned to pre-pandemic levels. The public summary gives no number for it.
- 3.3% a month, all separations, 2025
- Covers every employee on US nonfarm payrolls
- Large employers count more, because it is a share of all employment
- 12% a year, voluntary leavers only, 2025
- 2,371 member organizations responded, data not weighted
- A median of organizations, so a small firm counts as much as a large one
A company that sets its voluntary rate against the BLS total will look better than it is, because the BLS figure includes layoffs and retirements. A company that compares its all-leavers rate with SHRM’s 12% will look worse.
Does Turnover Change With Company Size?
Mid-sized workplaces lose the most staff to quits, and the largest lose the fewest. The BLS JOLTS size-class table for July 2026 puts the quits rate at 2.7% for private establishments with 50 to 249 employees and 1.0% for those with 5,000 or more.
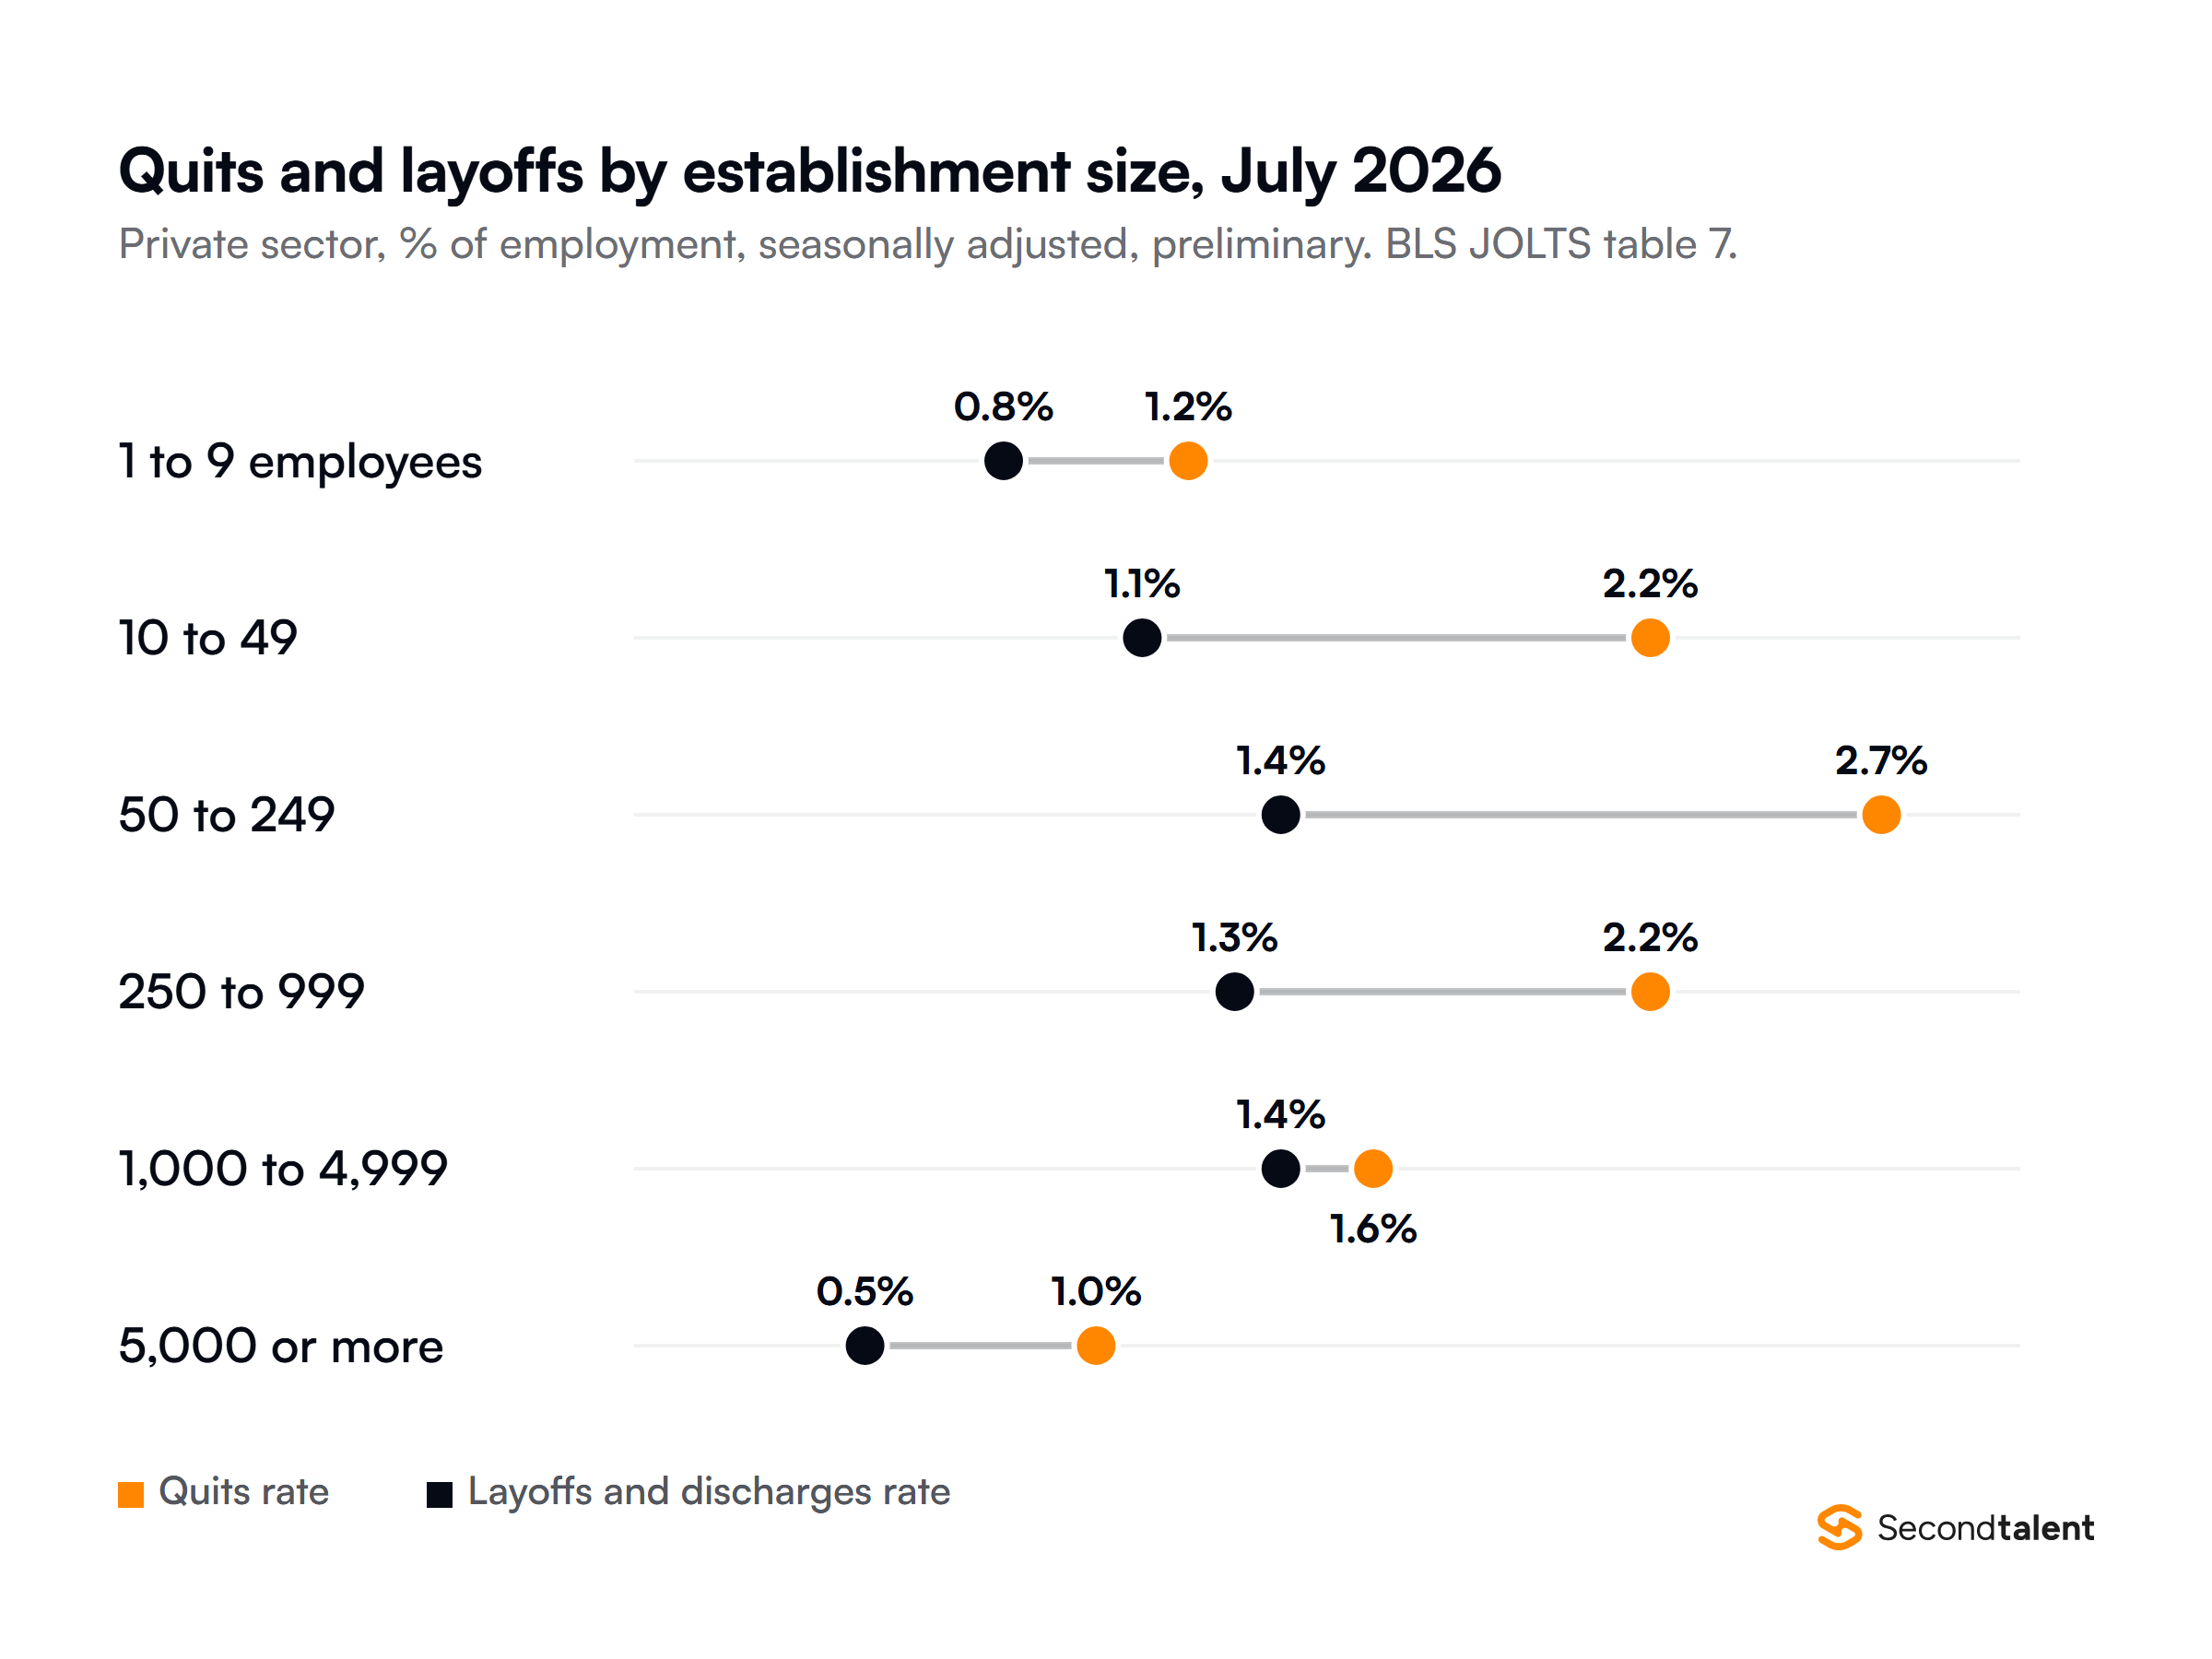
The smallest workplaces come second lowest, at 1.2% for sites with fewer than 10 employees. Layoffs and discharges peak at 1.4%, both at 50 to 249 employees and at 1,000 to 4,999, and fall to 0.5% at the largest sites.
Across the whole private sector, hires and total separations both ran at 3.5% in July 2026, with quits at 2.1% and layoffs and discharges at 1.2%. The size data leaves out government, which has low turnover, so these rates sit above the all-employer figures in our HR industry statistics.
How Long Does It Take to Fill a Job?
The median nonexecutive job took 39 calendar days to fill in 2026, shorter than the year before, in SHRM’s 2026 recruiting benchmarking of more than 4,600 organizations. Time to fill for executive roles did not change. More than two in three organizations reported struggles hiring for open positions.
Recruiters at the biggest employers are carrying more. Median requisitions per recruiter rose 67% at extra-large organizations in 2026. The median share of nonexecutive roles filled from outside the company went from 93% in 2025 to 97%.
SHRM’s 2025 benchmarking release broke the process into steps. Screening and interviewing each averaged 8 to 9 days, and an executive hire cost nearly seven times as much as a nonexecutive one. Its 2026 summary says the gap widened: executive cost per hire rose, while nonexecutive cost held steady.
Big employers post jobs faster than they fill them
The two rates use different bases, so they are not a strict ratio. The openings rate divides open jobs on the last day of the month by employment plus openings, while the hires rate divides a month’s hires by employment. The gap still shows where open roles stay open longest.
Quality of hire: the metric few track
Only 20% of organizations track quality of hire, SHRM’s 2025 benchmarking found. In LinkedIn’s 2025 Future of Recruiting report, 89% of talent acquisition professionals said measuring it will become more important, and 25% were highly confident their organization could measure it well. Those who do measure it most often use:
- Job performance: 66%
- Retention or turnover: 60%
- Hiring manager satisfaction: 44%
- Skills match: 44%
- Peer, team or client feedback: 37%
LinkedIn’s own platform version gives equal weight to three signals: recruiter demand for the person before the hire, staying at least a year, and moving to a second internal role within a year. The survey behind the report covered 1,271 recruiting professionals in 23 countries in September 2024.
61% of those professionals believe AI will help them measure quality of hire. Our AI in recruitment statistics track how recruiters use those tools today.
What Is the Average Absenteeism Rate?
In an average survey week of 2025, 3.2% of full-time US wage and salary workers were absent from work, and absences cost 1.7% of the hours they usually work. Illness or injury accounted for 2.2 points of the 3.2, according to the BLS Current Population Survey annual averages.
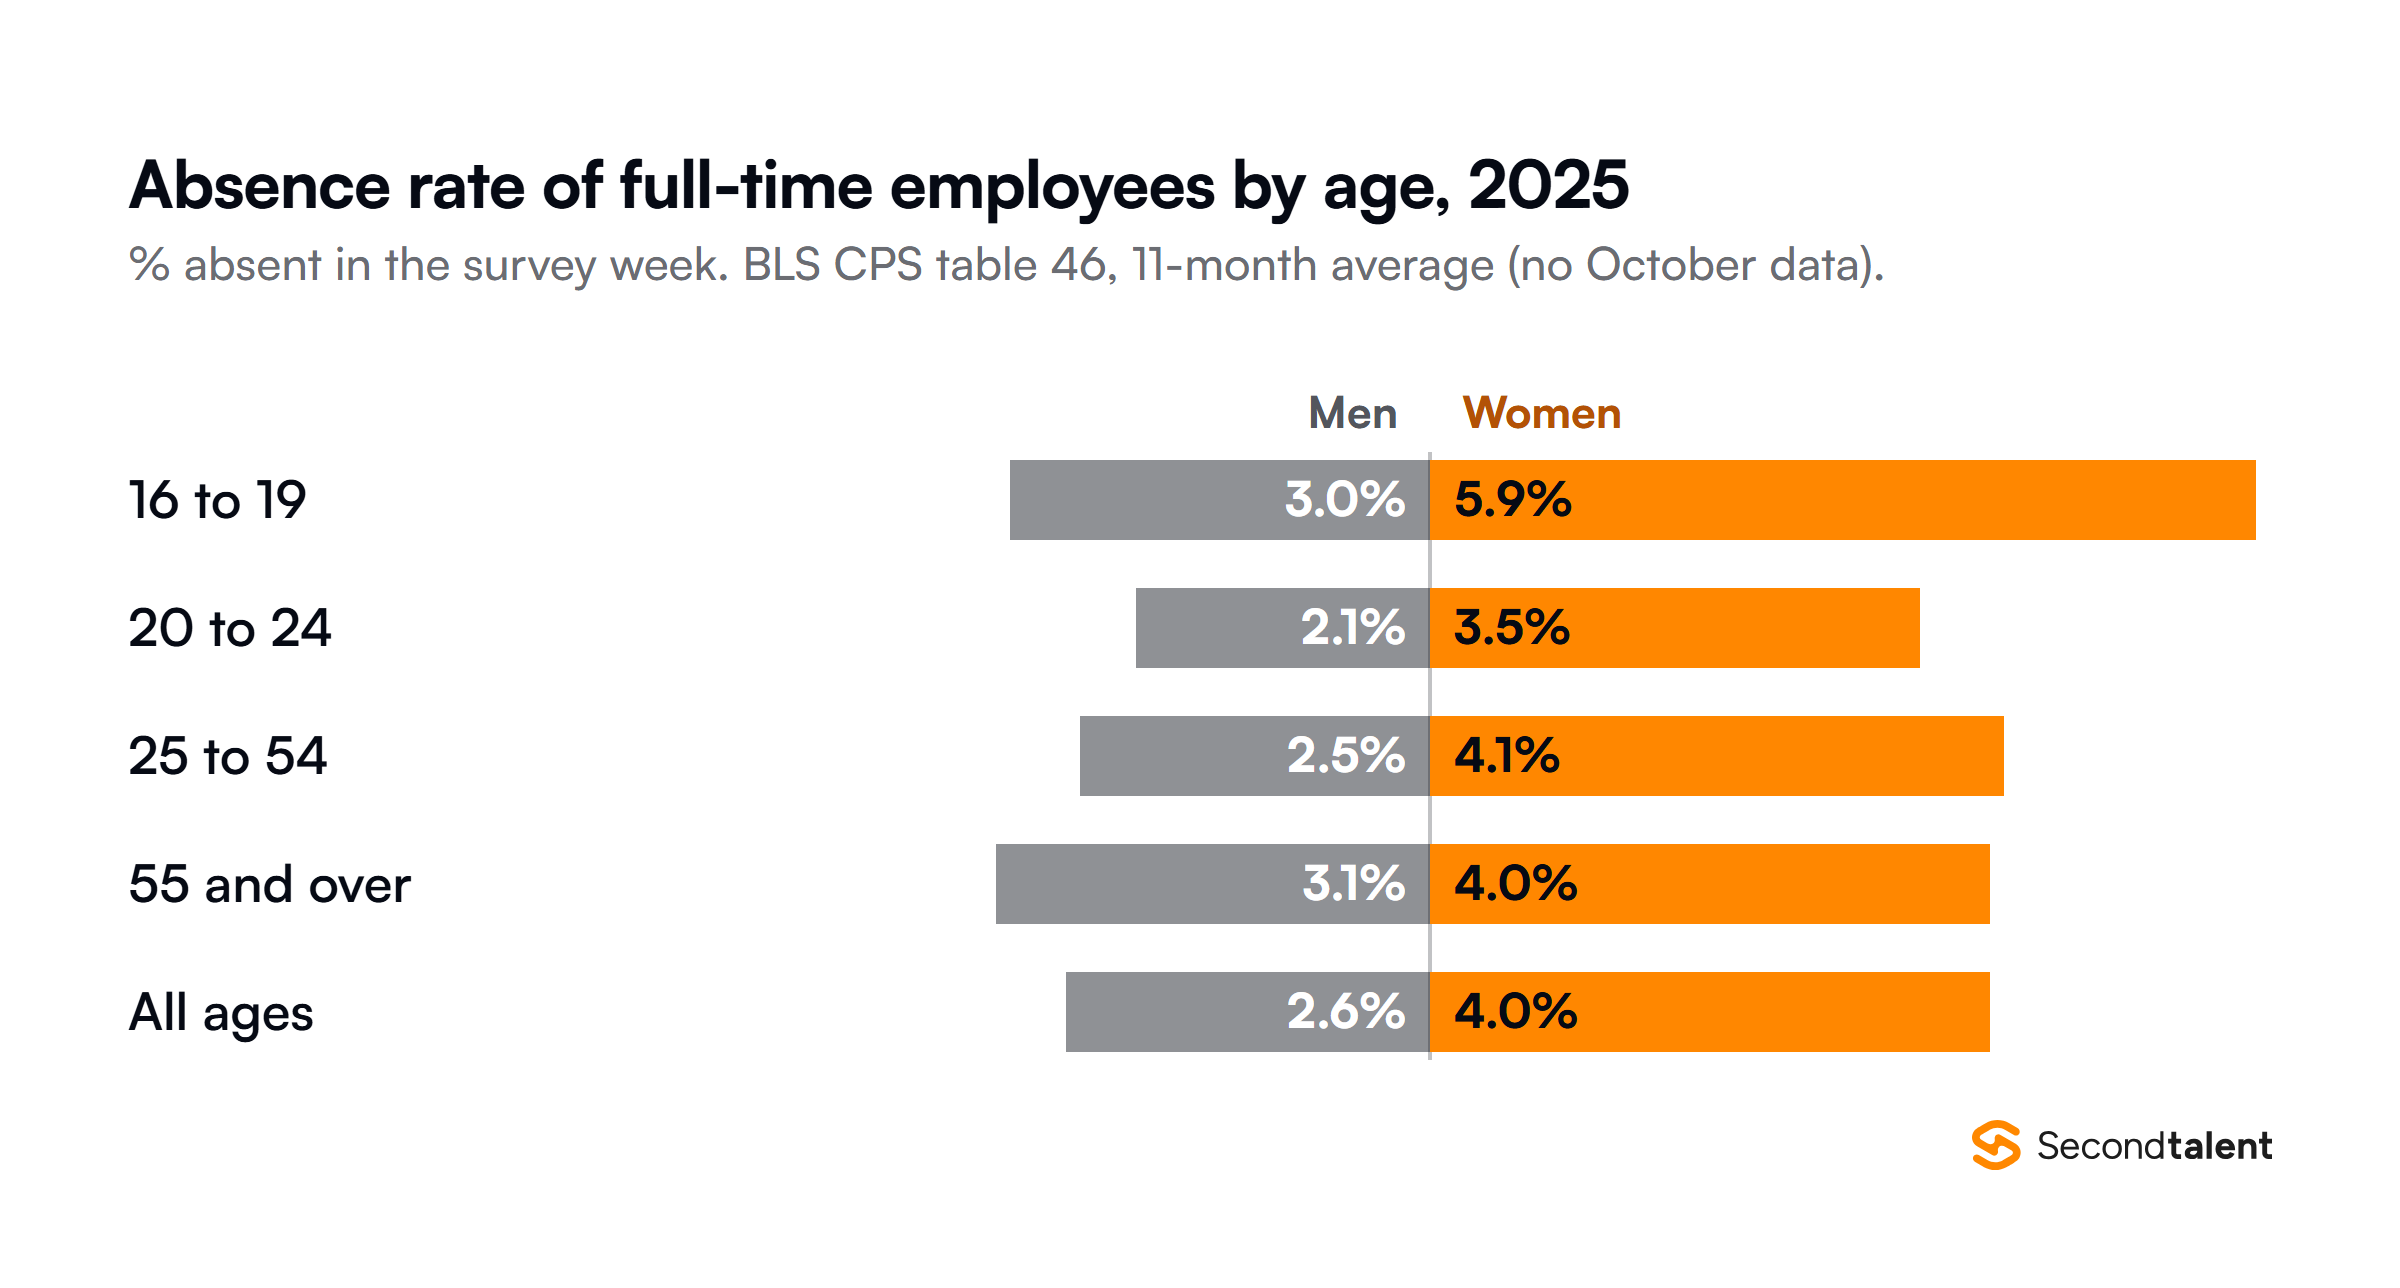
Women were absent at a rate of 4.0% against 2.6% for men, in the table by age and sex. The gap is widest among teenagers, 5.9% against 3.0%. Among employees aged 25 to 54, women’s absences for reasons other than illness, such as child care and family obligations, ran at 1.6%, twice the men’s 0.8%.
The public sector has the highest absence rate: 4.2%, against 3.0% in private industry, and 5.0% in the federal government. By job type, personal care and service workers (4.3%) and healthcare support workers (4.1%) were absent most. Management workers and architects and engineers were absent least, at 2.5% each.
How Is Employee Engagement Measured?
Gallup scores engagement from answers to its Q12 survey questions, and it counts 31% of US employees as engaged in the first half of 2026, unchanged from 2025. Another 18% were actively disengaged, and the remaining 51% fell in between as not engaged.
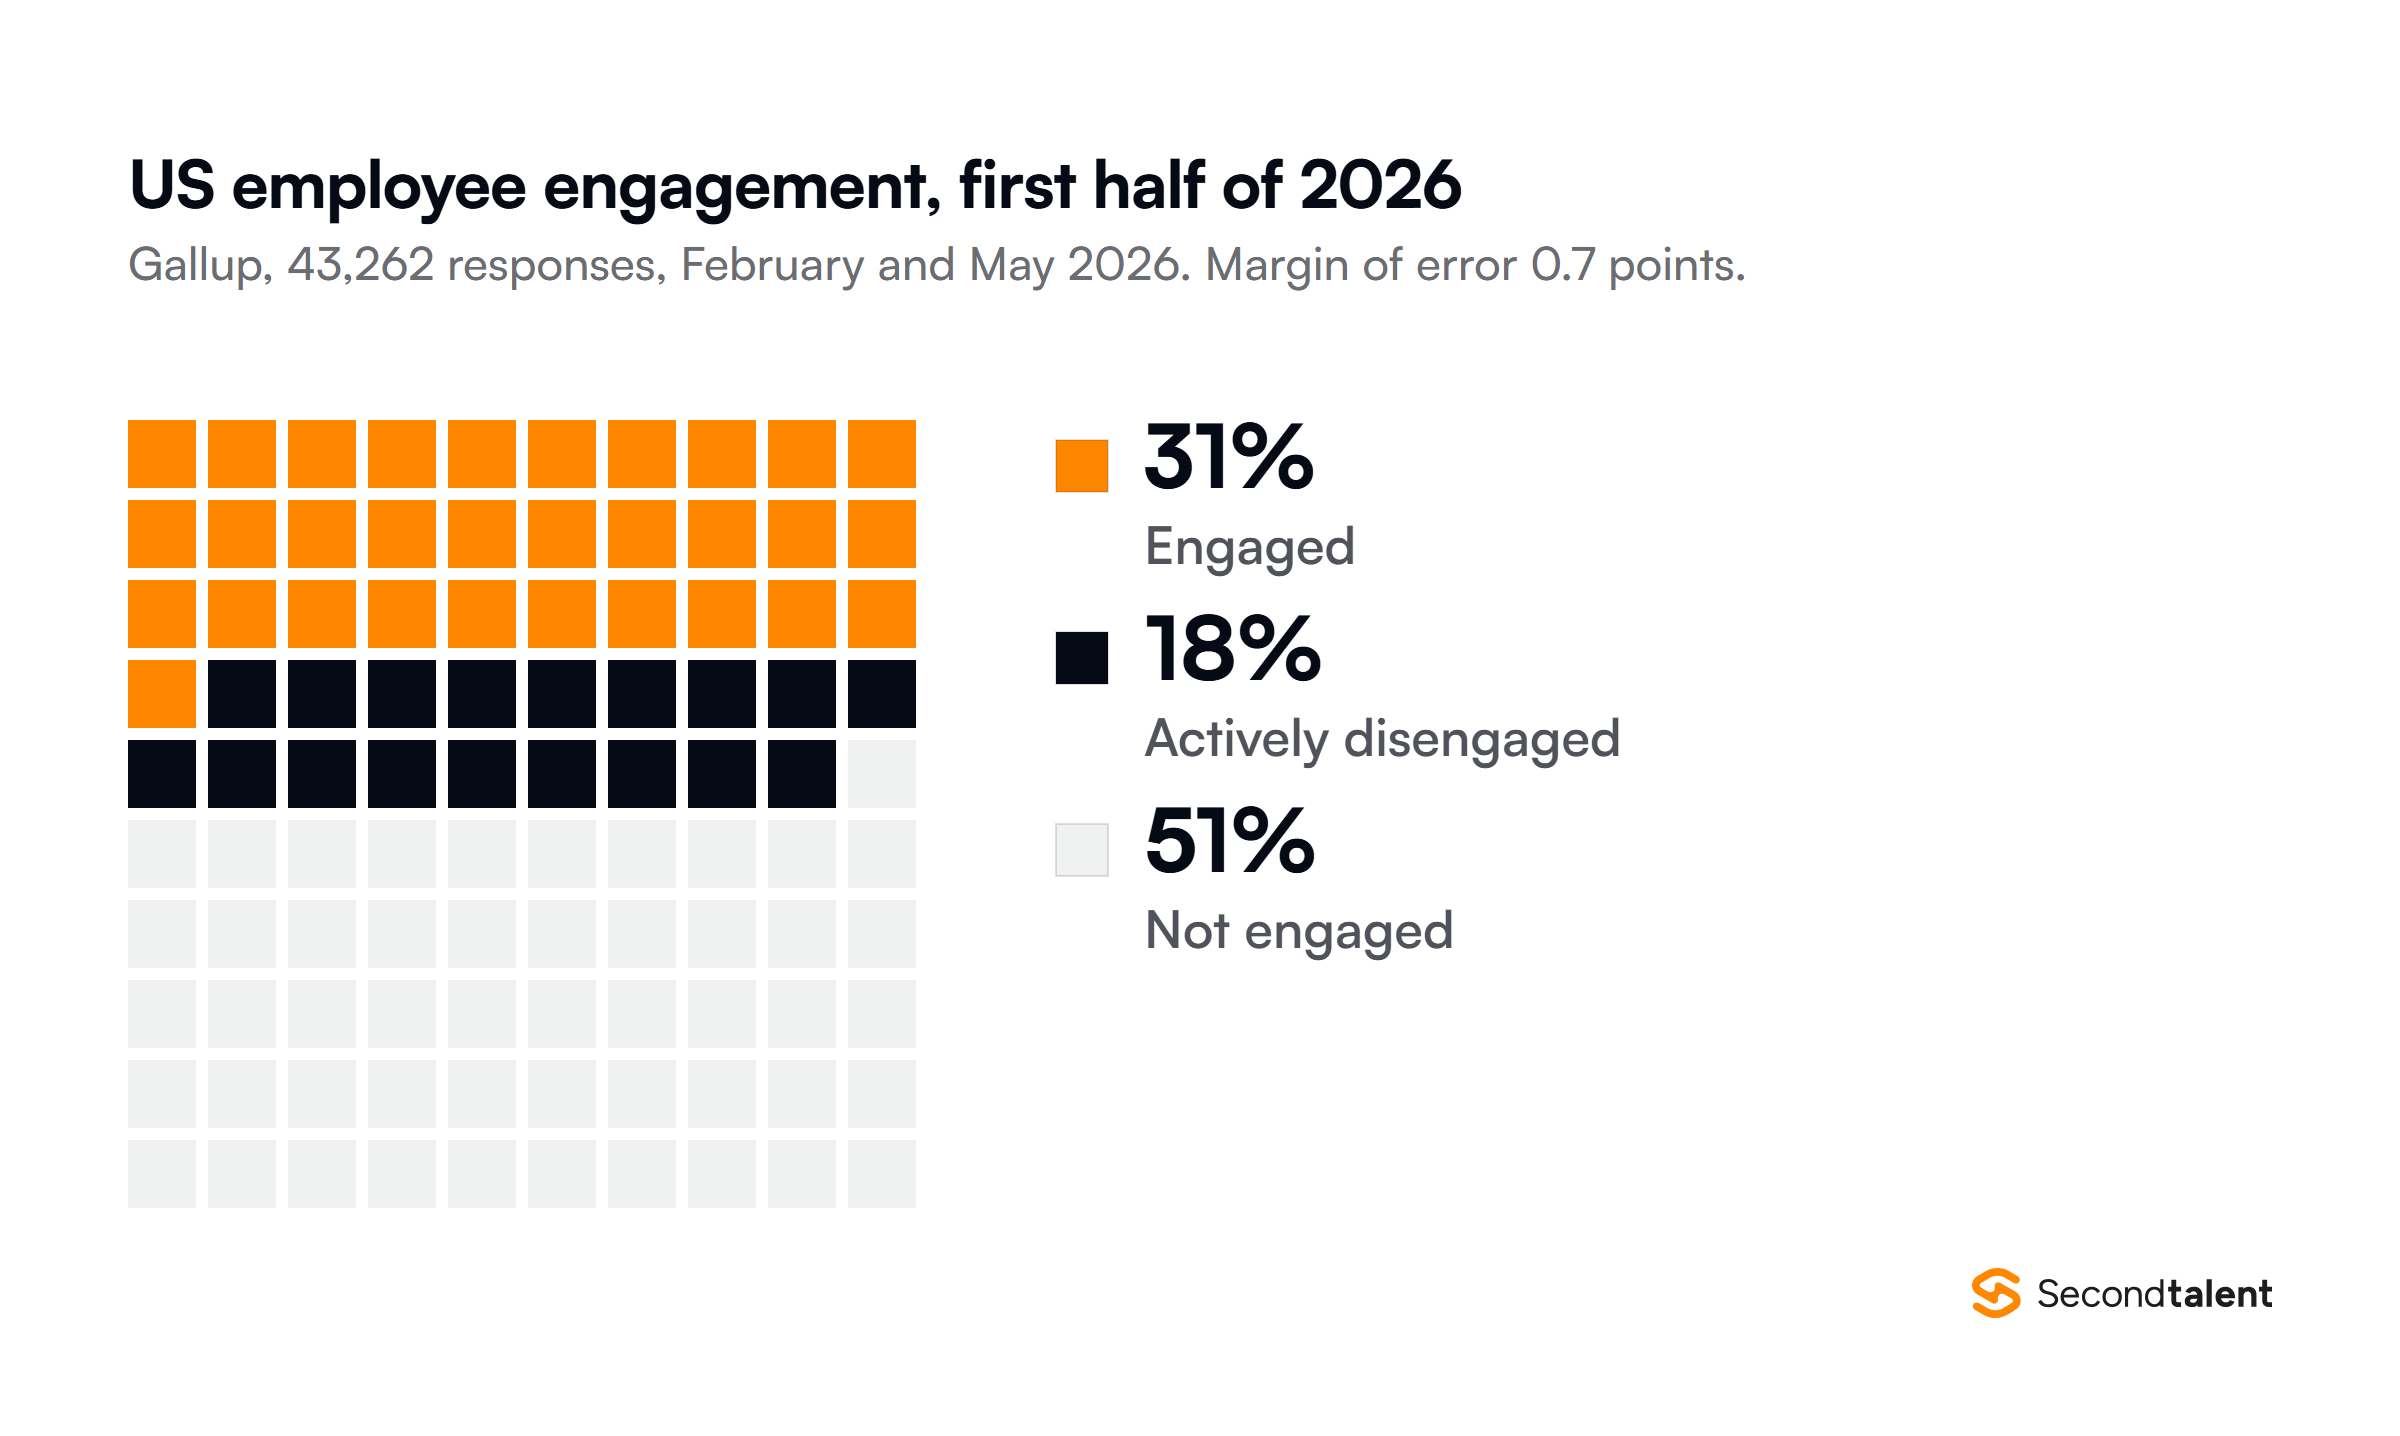
The sample is large. Gallup’s July 2026 release draws on 43,262 responses collected in February and May from the Gallup Panel, weighted to Current Population Survey targets. The margin of error is 0.7 points. US engagement peaked at 36% in 2020 and has sat at 31% since 2024.
Gallup counts only “strongly agree” answers. On one item, 49% strongly agreed that they know what is expected of them at work, up from 47% in 2025 but well below the 61% peak of 2015. For the worldwide figure, a separate Gallup series, see our HR industry statistics.
AI use and engagement
Inside US organizations that use AI, Gallup found higher engagement where three conditions held. The largest gap was manager support: 48% of employees whose manager actively backs the team’s AI use were engaged, against 30% of those who did not say so.
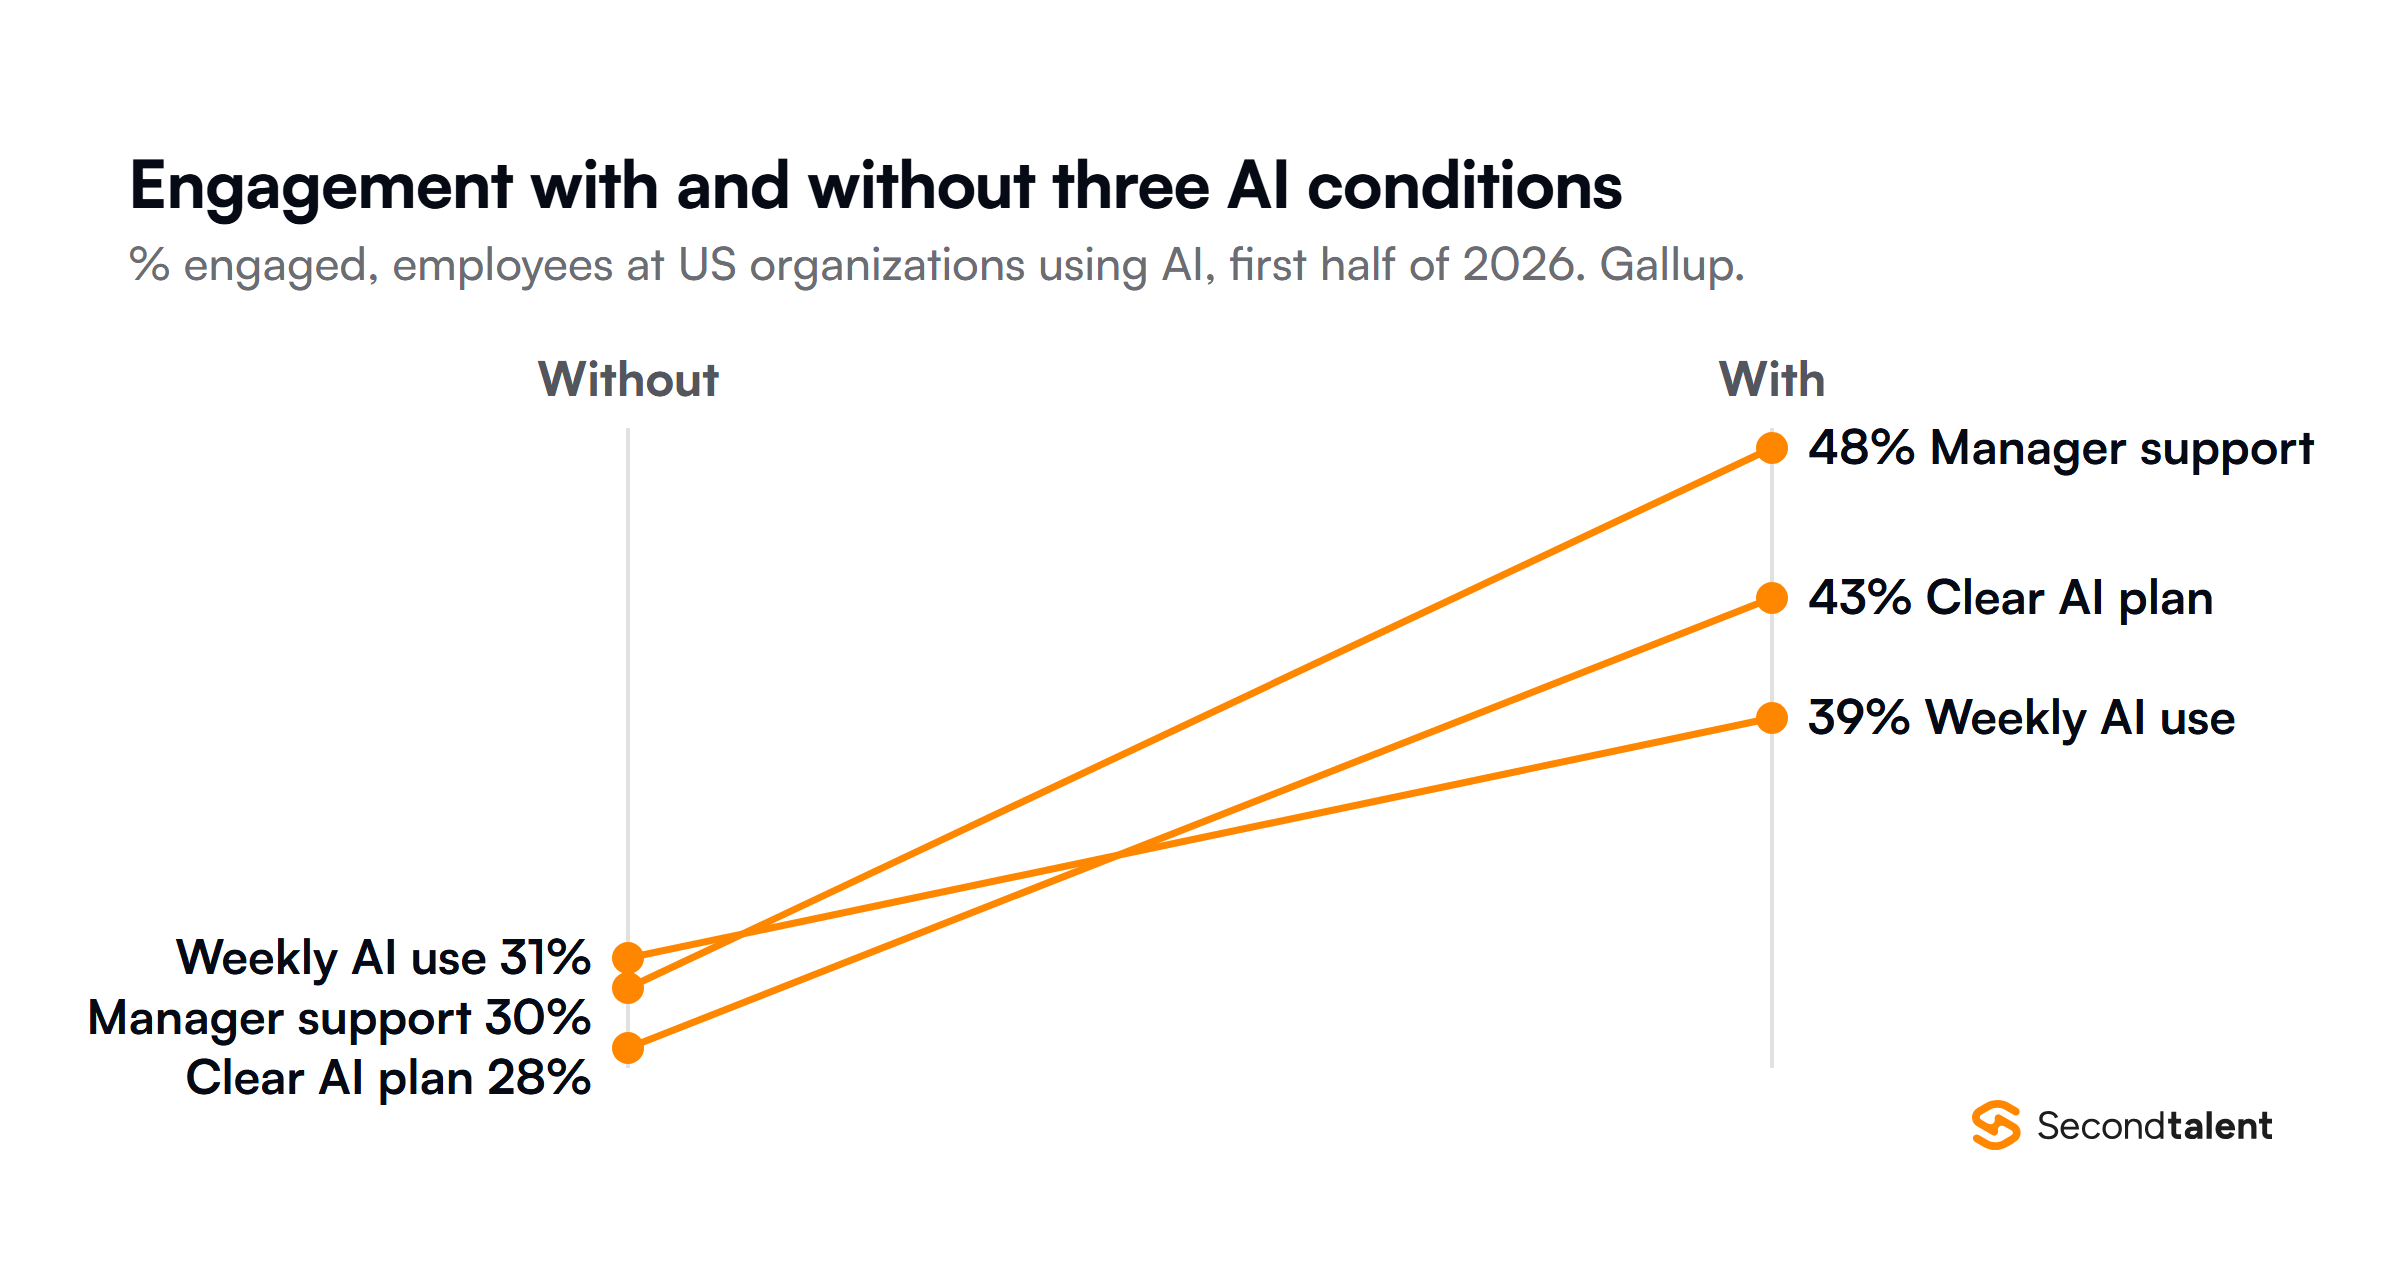
With all three present, frequent use, a clear integration plan and manager support, engagement reached 53%. The AI subsample was 21,724 respondents. These are links within one survey, and the data does not show whether AI use lifts engagement or engaged employees take up AI sooner.
What Does the HR Function Cost?
The median SHRM member organization spent $2,479 on HR for each full-time equivalent employee in 2025, more than double the $1,093 of 2022. HR took 2.4% of operating expenses, up from 1.4% in 2022 and 1.2% in 2017, and the median HR budget grew 9.1% on the year before.
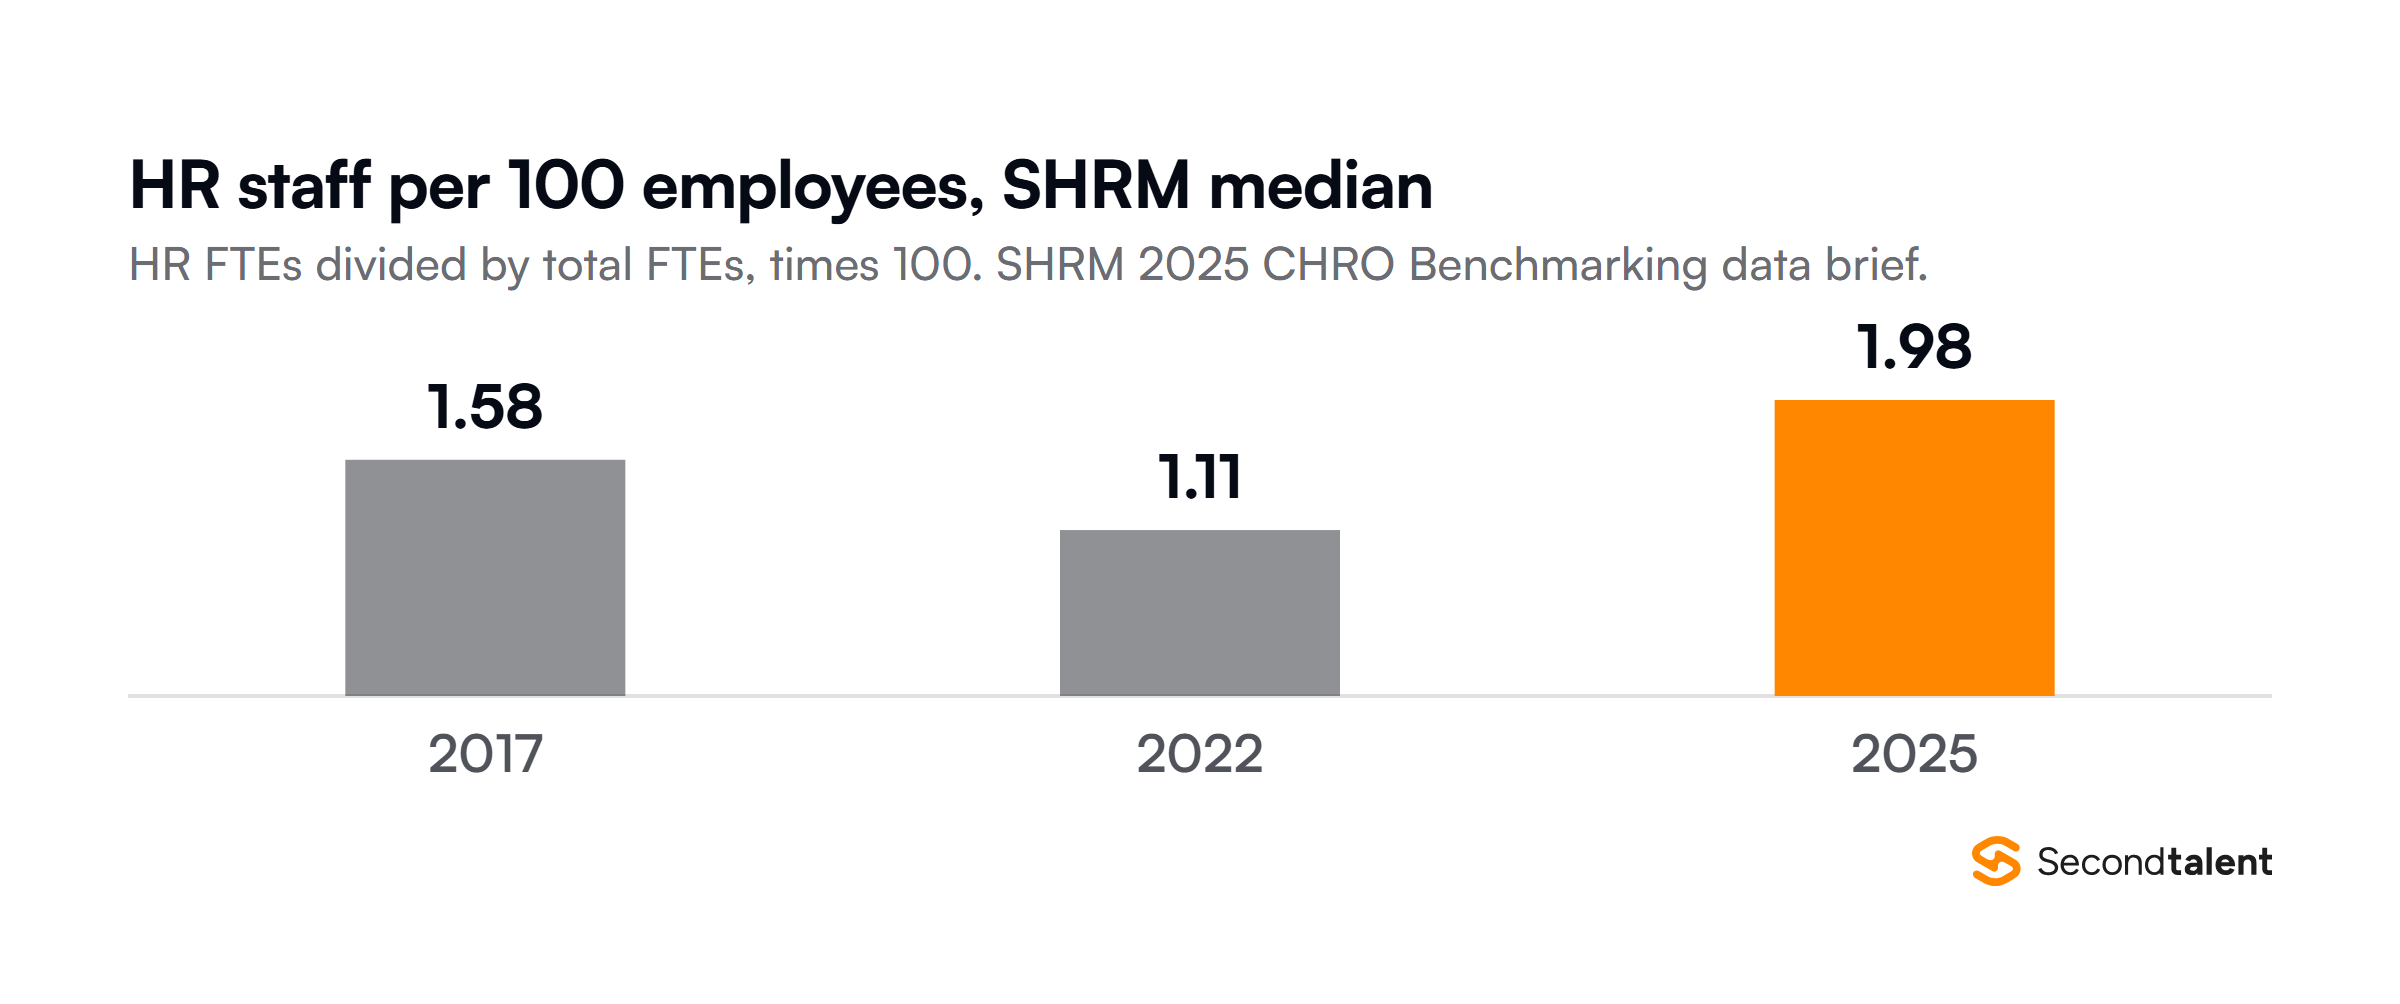
Professional, scientific and technical services firms grew their HR teams fastest. Their median rose from 1.31 HR staff per 100 employees in 2022 to 2.78 in 2025, and HR’s share of their operating expenses went from 1.8% to 5.5%. SHRM counts a part-time employee as half an FTE in its per-FTE ratios.
Compensation cost per hour
US employers paid an average of $49.46 an hour in wages and benefits for civilian workers in June 2026, according to the BLS Employer Costs for Employee Compensation release. Benefits made up 30.0% of private employers’ costs and 38.8% of state and local government costs.
Paid leave alone cost private employers $4.40 an hour for each full-time worker, 8.1% of compensation. Part-time private industry workers cost $25.20 an hour in total, and benefits were only 20.0% of that.
Benefit costs are rising faster than pay. The Employment Cost Index for private industry rose 3.3% in the year to June 2026, with wages and salaries up 3.1% and benefits up 3.8%. After inflation, private wages and salaries fell 0.4%.
Training hours and spend
The median organization gave eight hours of learning and development per FTE in 2026, the same as in 2025, SHRM’s 2026 L&D benchmarking found. The share of L&D budgets spent on outside training fell from a median 25% to 15%, with the biggest drops at small and midsize organizations.
Professional, scientific and technical services firms spent $543 per FTE, nearly twice the overall median. 32% of organizations offered AI upskilling beyond basic compliance training.
How Are HR Teams Using AI and People Analytics?
39% of organizations use AI in their HR functions, and another 23% use it only elsewhere in the business, which leaves roughly a third with none. The figures come from SHRM’s State of AI in HR 2026 research, drawn from 1,908 HR professionals across 138 HR tasks.
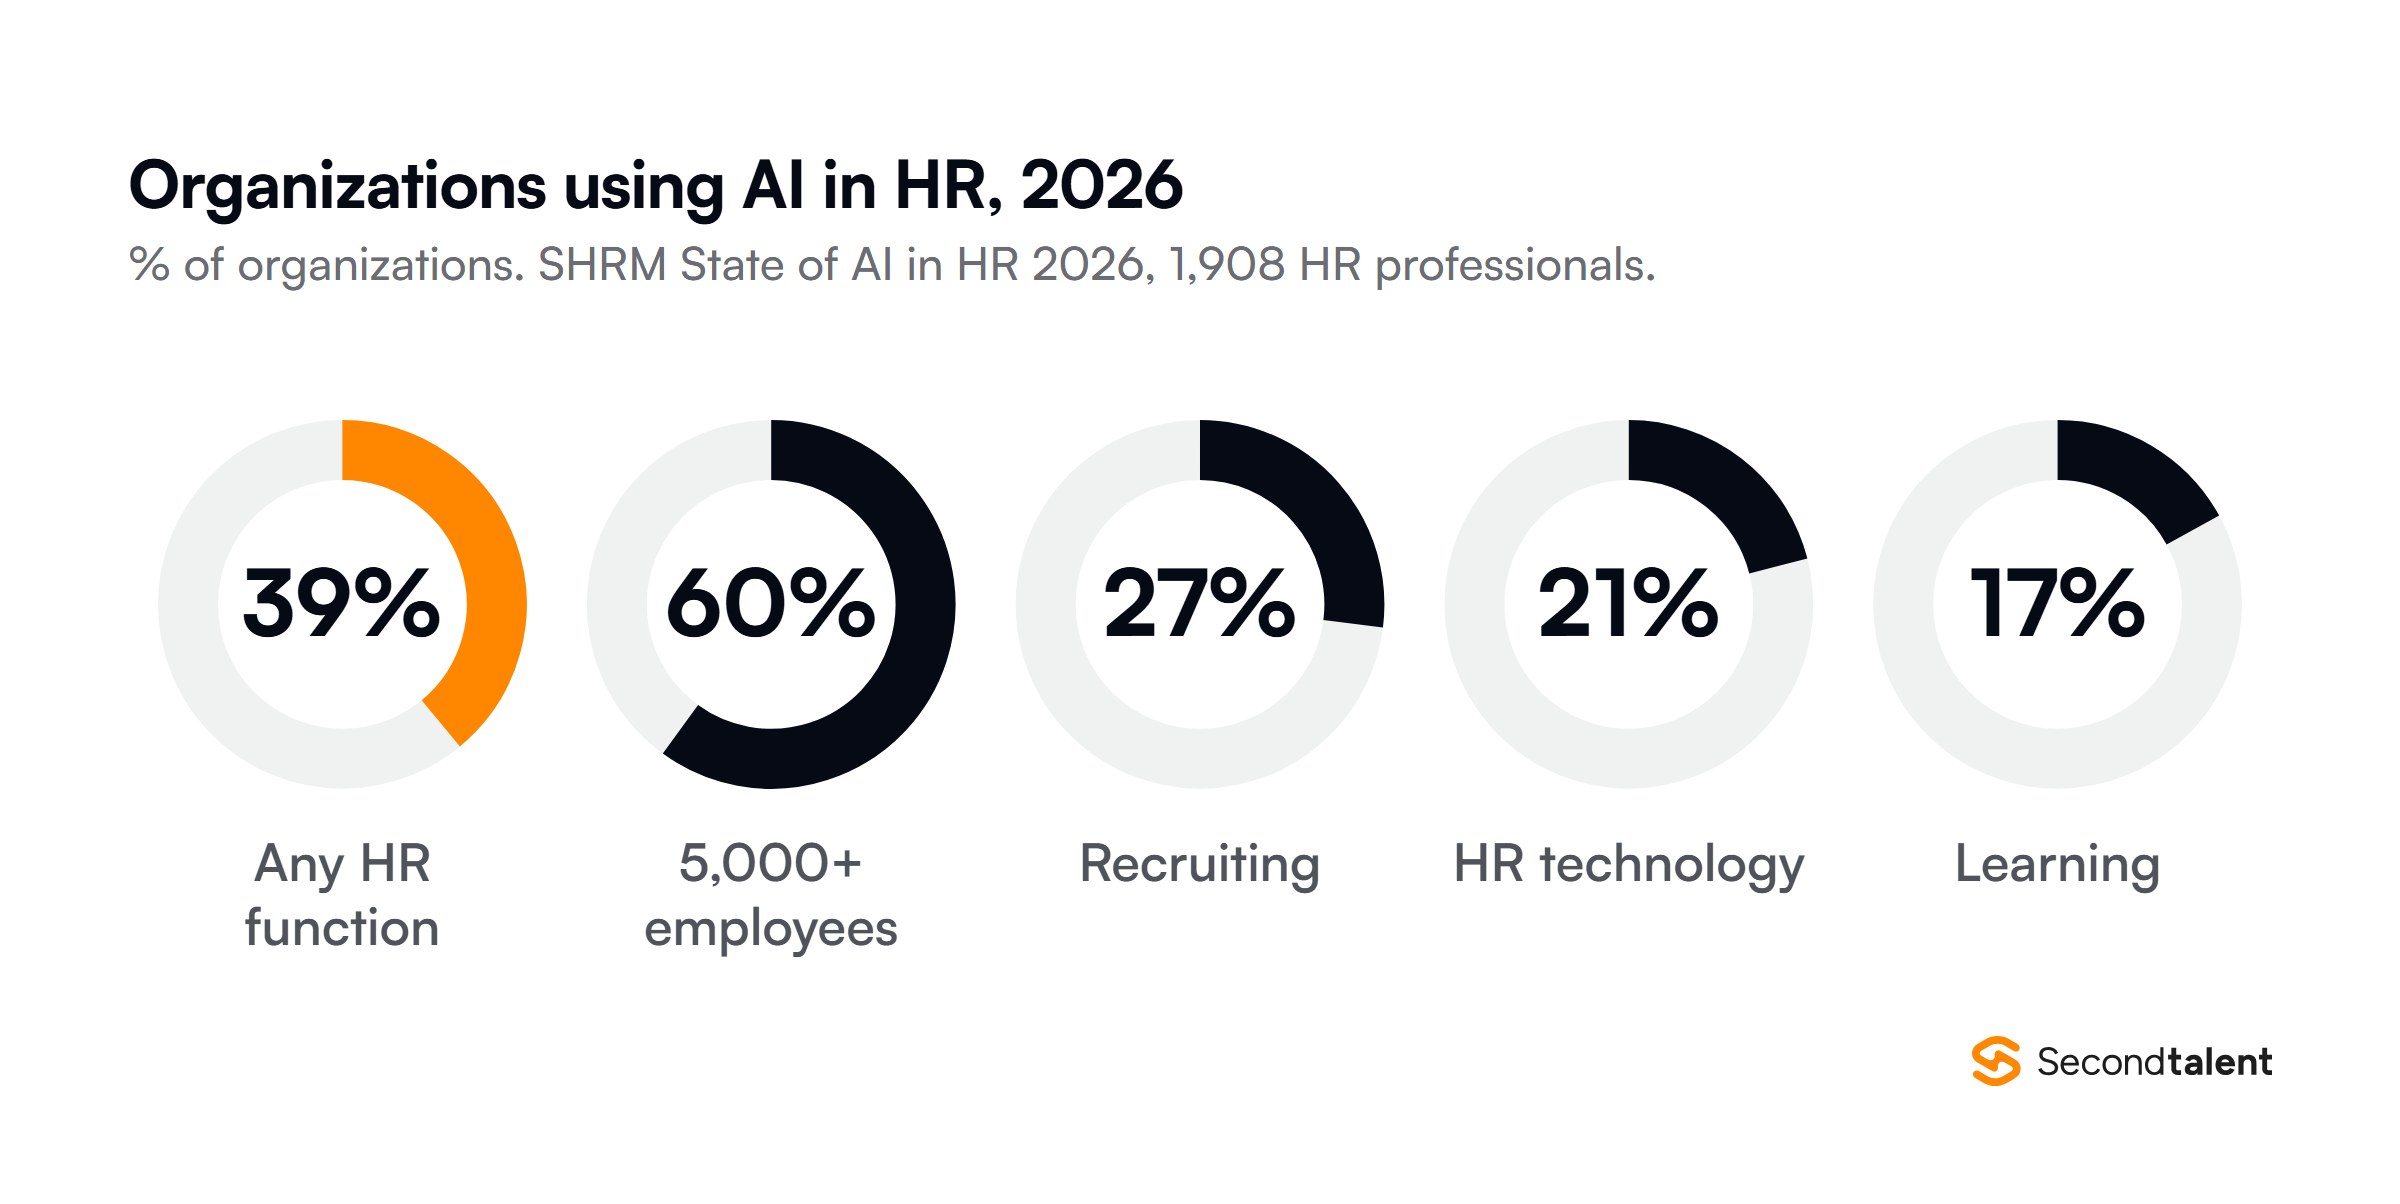
Recruiting leads, with 27% of organizations applying AI there, ahead of HR technology at 21% and learning at 17%. Organizational design and inclusion work sit near or below 5%. Organizations with 5,000 or more employees reach 60% adoption.
Among users, 87% report better efficiency and 75% better quality of work, but about half saw no improvement in decision-making.
Rules lag use: just under half of organizations have a formal AI policy. In the 19 states with AI workplace laws, 57% of HR professionals did not know about them. Our list of HR AI workflow examples shows where the tools fit.
What executives want from people analytics
57% of C-suite executives name better people analytics as the single people initiative most likely to pay off in 2026, HR Executive reported from Mercer’s Global Talent Trends 2026. Only 27% of executives say their HR team advises them well on human capital risks and opportunities.
Investors push the same way: 76% expect leading firms to prioritize analytics. The executives point to how data gets used. Two-thirds say their data shows what is most urgent rather than what is most important, and 55% say their organization underuses the workforce data it already holds.
Mercer’s survey reached nearly 12,000 executives, HR leaders, investors and employees in September and October 2025.
The 14 metrics ISO now requires
ISO 30414, the international standard for human capital reporting, gained auditable requirements in its second edition, released on August 24, 2025. It sets a baseline of 14 required metrics for organizations of any size, sector or country, grouped under 11 human capital areas.
The 2018 edition offered guidance only. The new one adds metrics for human rights, labor relations, productivity, ethics and workforce well-being, the gaps ISO’s committee identified in the first version.
Hiring Remote Employees in Asia With Second Talent
If your time-to-fill numbers point at roles you cannot fill locally, Second Talent matches companies with pre-vetted developers and other remote employees across Asia. Our employer of record service employs them for you, with local contracts and payroll, so you do not need an entity in each country.
For what employer contributions look like in one market, read our Philippines payroll, benefits and tax guide. Tell us which role you need to fill and we will send matching profiles.
Frequently Asked Questions
How do you calculate employee turnover rate?
Divide the number of employees who left during a period by the average number of employees in that period, then multiply by 100. SHRM applies this to a fiscal year and counts only employees who chose to leave. Include layoffs and retirements if you want a figure comparable with BLS total separations.
How much of the HR budget goes to recruiting?
In SHRM’s 2025 benchmarking, recruiting took an average of 26% of the HR budget and a median of 20%. The middle half of organizations spent between 10% and 39%. Learning and development took a median 15% of the HR budget.
When is new US turnover data released?
BLS publishes JOLTS monthly, about a month after the month ends, and the August 2026 data is scheduled for September 29, 2026. The annual tables by industry were last updated on March 13, 2026. The next employer compensation cost release, for September 2026, is due on December 16, 2026.
Is 31% engagement low?
It is below the recent US high. Gallup’s US figure reached 36% in 2020 and has held at 31% since 2024, with 18% actively disengaged in the first half of 2026. Gallup counts only “strongly agree” answers, so a survey that also counts “agree” will print a higher share on the same question.

![Workplace Diversity Statistics. Top 100+ Workplace Diversity Statistics [2026], by Second Talent.](https://www.secondtalent.com/wp-content/uploads/2026/09/workplace-diversity-statistics-featured-v2-768x403.jpg)
![Tech Industry Hiring Statistics. Top 50+ Tech Industry Hiring Statistics: Salaries, Skills Demand [2026], by Second Talent.](https://www.secondtalent.com/wp-content/uploads/2026/09/tech-industry-hiring-statistics-featured-v2-768x403.jpg)